Experimenting On My Hearing Loss

WARNING: Some of the audios shared in this blog post may be disturbing and hurt your/your pet’s ears. Don’t play them at high volume.
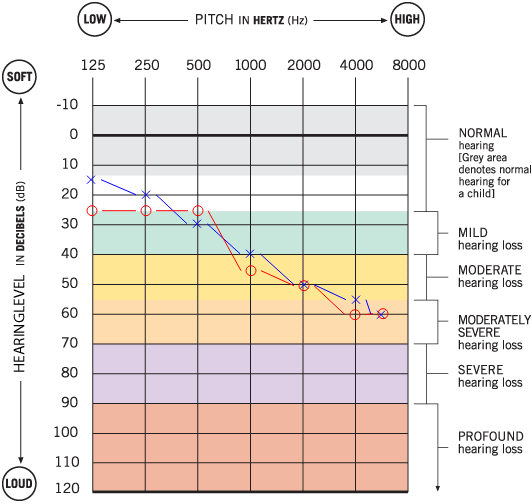
I have a slight sensorineural hearing loss in both of my ears from birth. My hearing loss isn’t that serious but I need to use hearing aids in my daily life. Lately, I was thinking about altering my computer’s audio output according to my audiogram. An audiogram is basically a frequency-dB threshold graph. You can see my audiogram below:

It’s easy to read an audiogram. In audiograms, 0 dB indicates the quietest sound that a normal young person can hear. Here, the red line shows my right ear’s threshold values and the blue one belongs to my left ear’s. Let’s follow the red line. According to my audiogram, at the frequency of 250 Hz, the lowest I can hear is the sounds at 25 dB. At 6000Hz, I can’t hear any sound below 60 dB. Audiograms usually show threshold dBs between 125 Hz and 8000 Hz because that is the frequency range of the human voice.
What I want to do is to add a dynamic gain to the output audio depending on its frequency range. Simply, I want to be able to use my computer without the need for my hearing aids. To achieve this, I’m going to write a LADSPA plugin and use it with Pulseaudio. Here is my previous post on how to write one. In this post, I won’t get into LADSPA, I’ll just talk about my explorations on some audio files.
Before we start you may want to read about sampling and fourier transform. A better explanation of the fourier transform could be found here.
First, let’s generate audio from sine waves with frequencies from 440 Hz to 8000 Hz and a sample rate of 44100 Hz:
1 | from scipy.io import wavfile |
And the output is:
What we’re going to do is, first take a little part of the samples that we have generated. This will be our window. We’ll do a Fourier transform on this window and get into the frequency domain. Then we’ll find the frequency with the highest dB which will be our dominant frequency. We’ll determine how much gain is needed at that frequency according to the audiogram and apply it to the window. We’ll repeat this for all windows. We’re going to use python to achieve all this for the sake of convenience.
audiogram variable keeps values of the above audiogram at the beginning of this post. basedB is rather an important variable. We’ll calculate our gain according to it. Let’s say, if we find that a window has a dominant frequency of 4000 Hz, then we need to apply 60.0 - 20.0 = 40.0 dB gain to that window. It’s just the difference between how much normal people hear and how much I hear. That’s why the basedB variable should be chosen from the normal people’s hearing range.
1 | from scipy.io import wavfile |
Here is the function that will calculate dominant frequency. What it does is simple: it applies a fourier transform to the given window, finds the index of highest amplitude, and finally returns the corresponding frequency value.
1 | # find dominant frequency in the window |
getGain finds the threshold value according to the audiogram and returns its difference from the basedB value. That’s the gain we want to apply to our window.
1 | # how much gain should we apply? |
Simple function to convert dB to amplitude. See demofox’s blog.
1 | # converts dB to amplitude |
And now the main part. Here you can see that, first, the wav file is loaded into memory as samples, then the samples are iterated over in chunks of window with the size of 1024, getDominantFreq and getGain functions are called on and a gain was applied to those windows accordingly. At the last step, the new samples are written into processed.wav file.
1 | if __name__ == "__main__": |
Now let’s run our code on the sine waves we’ve generated:
1 | $ python3 version1.py generated.wav |
We can see that higher gain is applied to higher frequencies which is what we want. Let’s try this in a real-world example. Now take a look at the little part of one of my favorite books:
Let’s run our code with this recording:
1 | $ python3 version1.py canticle_for_liebowitz.wav |
Damn. It hurts my ears. The problem here is we’re applying gain even though it’s in my hearing range. For example, we shouldn’t add gain to 65 dB audio at any frequency. Also even if it’s out of my hearing range, we shouldn’t boost it too much. Let’s say if we have an audio with 55 dB at 4000 Hz, we shouldn’t amplify it to 85 dB which is too high. All we have to do is to shift it into my hearing range.
But what is 55 dB? For example, when we have an amplitude of 0.1, we can calculate the dB equivalent as 20 * log(0.1) = -20 dB. Or we know 0 dB is full boost of the volume by 10^(0/20) = 1.0. So, again, what the hell is 55 dB in “audiogram language” supposed to be?
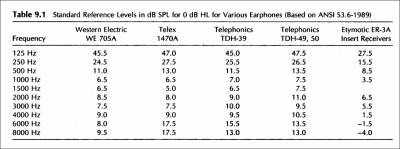
The answer lays in dB HL and dB SPL. HL stands for Hearing Level and SPL stands for Sound Pressure Level. dB SPL is basically the measurement of sound pressure. So the sound that makes no pressure is 0 dB and others are higher than 0 dB. Hearing levels are dB SPLs that are tailored for an audiogram. Do you remember in audiograms people’s hearing range starts from 0 dB? Well, that 0 dB HL is higher than 0 dB on the SPL scale and is different at every frequency because of how much the human ear hears. Here is a good reading on it.
There are many dB HL to dB SPL conversion charts. These conversions vary between the audiometers and the earphones used on those audiometers.

The problem here is I don’t know the standard of my audiogram’s calibration and I don’t know which earphones they have tested me with. So, we need to gather our own data. Let’s do our own hearing test! But this time we won’t be using dB SPL, we’ll just measure the usual dB values from my computer. The result will be specific to my computer but that’s fine. At least it’s going to be reliable.
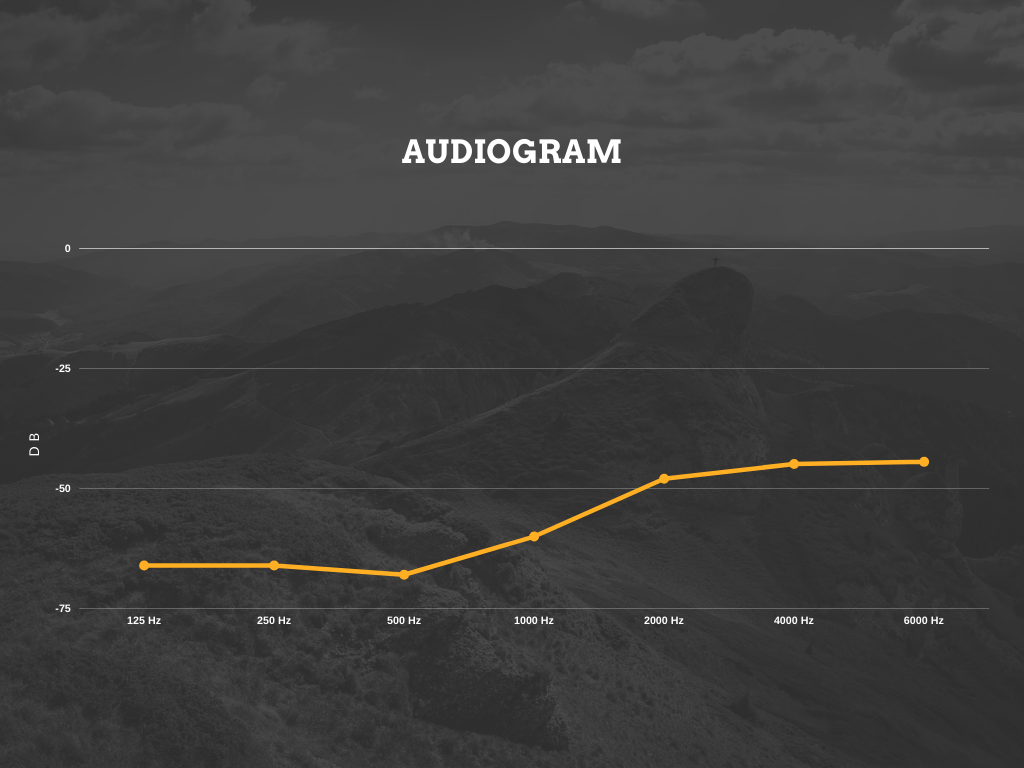
Let’s create sine waves at the frequencies 125 Hz, 250 Hz, 500 Hz, 1000 Hz, 2000 Hz, 4000 Hz, and 6000 Hz with decreasing volume. Then, I’ll listen to the audio files and mark the last points I can hear something.
1 | import numpy as np |
Ok, the results are in. Look at that cool audiogram I created at canva.com:

Haha. Now let’s edit our code. We’ll remove the basedB variable and add our new audiogram to the code:
1 | audiogram = [ # rows [ Hz, dB ] |
We’ll slightly edit getDominantFreq to return dominant frequency’s dB:
1 | # converts amplitude to dB |
Now getGain(). We’ll just change the return part:
1 | # how much gain should we apply? |
Have you noticed what we’ve done? Now we’re checking whether the samples are in my hearing range. If I can hear it, no need to apply gain because err, I can hear it. If it’s out of my hearing range we’re just moving it to my hearing range. We don’t amplify it too much because it’s going to distort the sound. Remember our first try.
We won’t be touching the rest of the code so the final version is below:
1 | from scipy.io import wavfile |
And let’s see what it does:
That’s very good! Do you hear the little distortions in between? They don’t sound distorted to me. Of course, they don’t sound natural but I can understand what the narrator says easier this time.
I learned a lot from this process, especially how my ear works, how sound works. I can’t believe I haven’t looked into it to this day. I want to develop some other projects on my hearing impairment and I may even make my own hearing aid. Have a nice day, see you in my next post.
Note: Here is the dicussion link of the post.